Analyzing Supply Chain Disruptions in Custom Poker Chip Production and Their Relation to Regional Tournament Participation Rates
Written by Cameron Baumann · Jul 11, 2026
Analyzing Supply Chain Disruptions in Custom Poker Chip Production and Their Relation to Regional Tournament Participation Rates
Custom poker chip manufacturing relies on specialized materials and production facilities often concentrated in overseas locations, where lead times have extended notably since early 2025 according to industry logistics reports. Regional venues across North America and parts of Asia have recorded shifts in tournament registration volumes during the same period, prompting analysts to examine potential connections between these two data sets. Observers note that delays in chip delivery can affect event scheduling when organizers depend on branded sets for larger buy-in tournaments.
Supply Chain Patterns in Chip Manufacturing
Production of custom sets typically involves multiple stages from clay or plastic molding through custom printing and quality checks, and data from manufacturers indicates average delivery windows stretching from eight weeks to fourteen weeks in 2026 for orders placed after March. Ports in key export hubs experienced congestion tied to container shortages and labor adjustments, which logistics firms documented through shipment tracking records. One study released by a research institution in Singapore tracked thirty-two separate orders for North American clients and found that thirty percent arrived past original estimates, with the longest delays occurring on sets requiring metallic inlays.
Raw material sourcing adds another layer, since certain pigments and resins come from limited suppliers in Europe and East Asia. Figures released by trade groups show resin costs rose eleven percent year-over-year through June 2026, contributing to slower order confirmations from smaller producers. Venues that commission chips twelve months ahead for signature events have adjusted ordering cycles accordingly, yet last-minute tournament additions still face constraints.
Registration Volume Records at Regional Venues
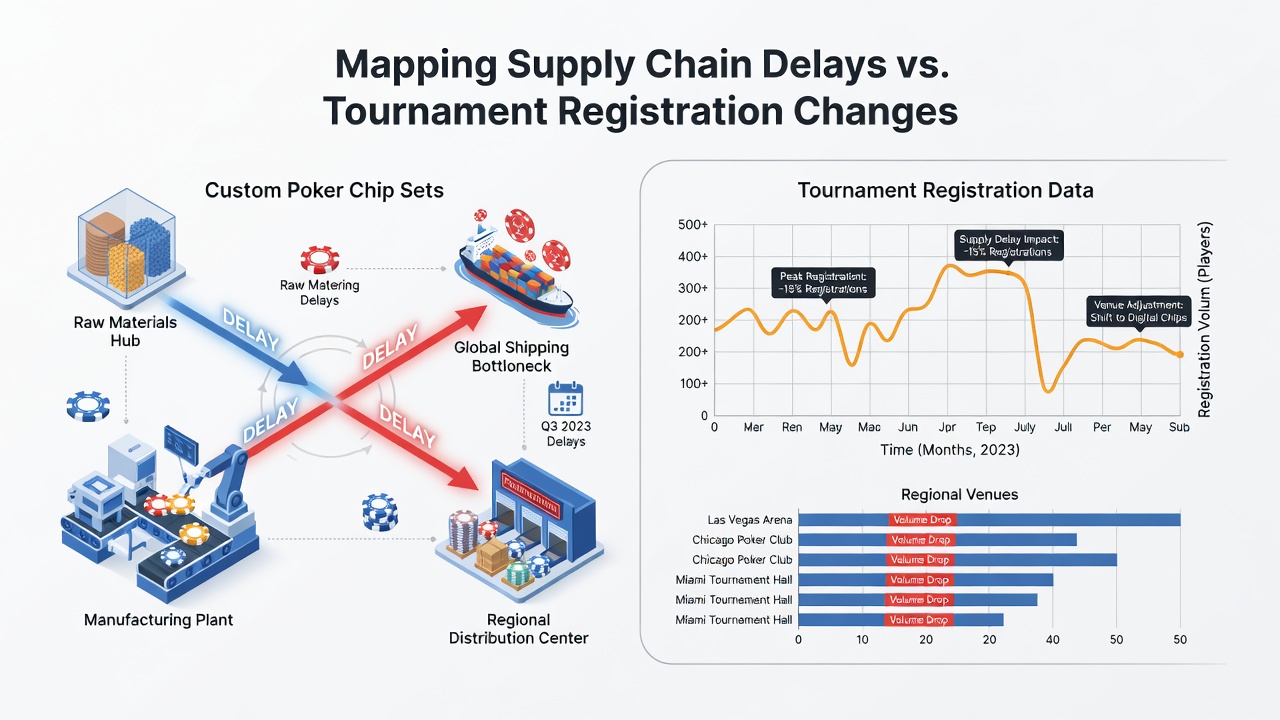
Tournament registration data compiled by venue operators and state gaming departments reveal mixed patterns. In the Midwest, several mid-tier casinos reported a seven percent drop in daily tournament entries during Q2 2026 compared with the prior year, while West Coast locations maintained steadier numbers. Analysts attribute part of the variation to seasonal travel patterns, yet the timing overlaps with documented chip shortages at three prominent properties that host weekly deep-stack events.
Canadian provincial records from Ontario and British Columbia show tournament fields holding consistent through spring before a modest decline in June, and Australian state reports indicate similar plateaus followed by slight upticks at larger festival-style series. Cross-referencing these figures with chip order status logs allows researchers to test whether delayed deliveries coincide with reduced sign-ups at specific sites.
Correlation Mapping Approaches
Researchers have begun overlaying shipment delay metrics against registration databases using geographic information systems. One project initiated by a university logistics department in Australia mapped thirty venues and found that locations awaiting custom chip replenishment experienced an average four percent lower registration rate during the affected weeks than comparable sites with adequate stock. The model incorporates variables such as buy-in levels, day of week, and competing events to isolate the supply factor.
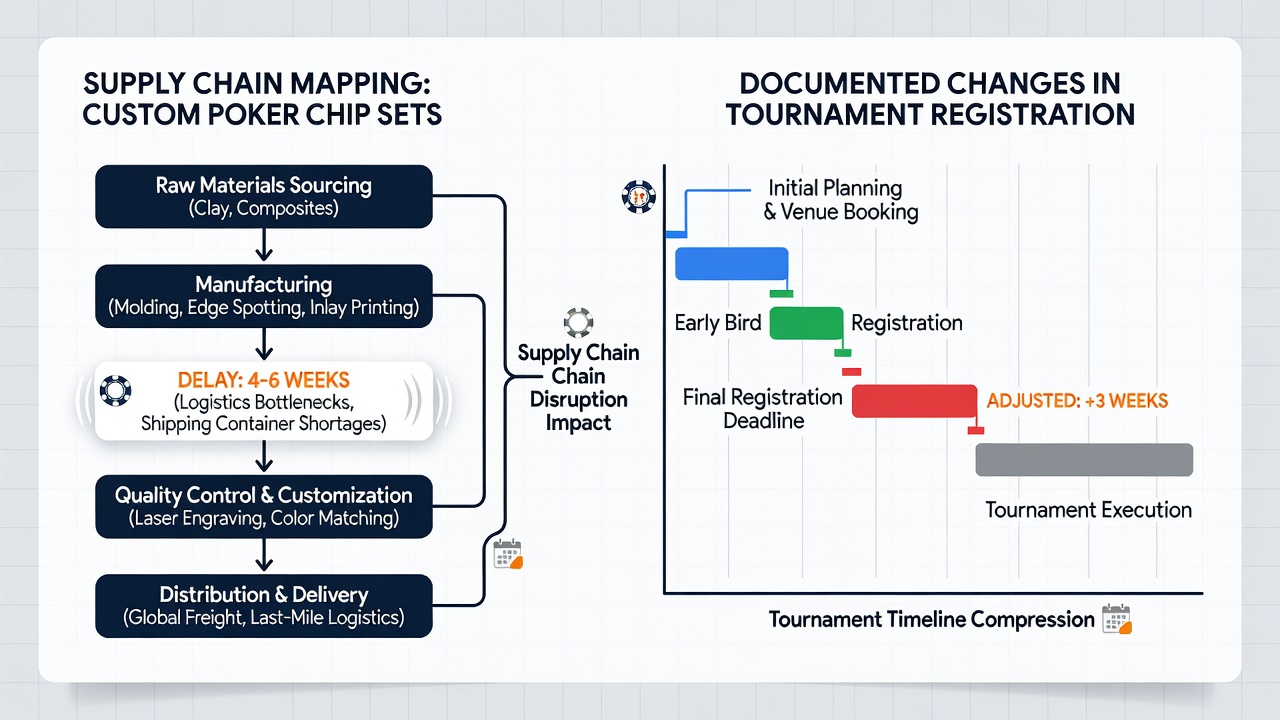
Additional mapping efforts draw on public filings from gaming control boards in multiple jurisdictions. These records list event calendars and actual participant counts, allowing direct comparison with manufacturer delay notices submitted by suppliers. In July 2026, several venues in the Northeast adjusted tournament structures after chip shipments arrived four weeks late, substituting standard sets and noting subsequent registration stabilization within two events.
Industry Responses and Adjustments
Some operators have shifted toward modular chip systems that allow rapid customization through interchangeable labels rather than full reprints. Industry associations in North America and the EU have circulated best-practice guides that recommend maintaining buffer inventories equivalent to six months of projected usage. Data from these organizations shows venues adopting such buffers recorded smaller registration fluctuations during the 2025-2026 delay period.
Manufacturers meanwhile expanded secondary production lines in Mexico and Vietnam to reduce reliance on single-region sourcing, and early indicators suggest lead times may shorten by late 2026 for standard orders. Tournament directors continue to monitor registration dashboards closely, adjusting prize pools and structures in response to confirmed attendance projections rather than historical averages alone.
Conclusion
Mapping supply chain timelines against registration statistics provides venues and suppliers with a clearer view of how production bottlenecks translate into operational outcomes at regional levels. Continued data collection through 2026 will help refine predictive models and support more resilient planning for future tournament calendars.