Mapping Seasonal Fluctuations in Online Sports Wager Volumes Through Anonymized Transaction Datasets from Multiple Jurisdictions
Written by Cameron Baumann · Jun 29, 2026
Mapping Seasonal Fluctuations in Online Sports Wager Volumes Through Anonymized Transaction Datasets from Multiple Jurisdictions
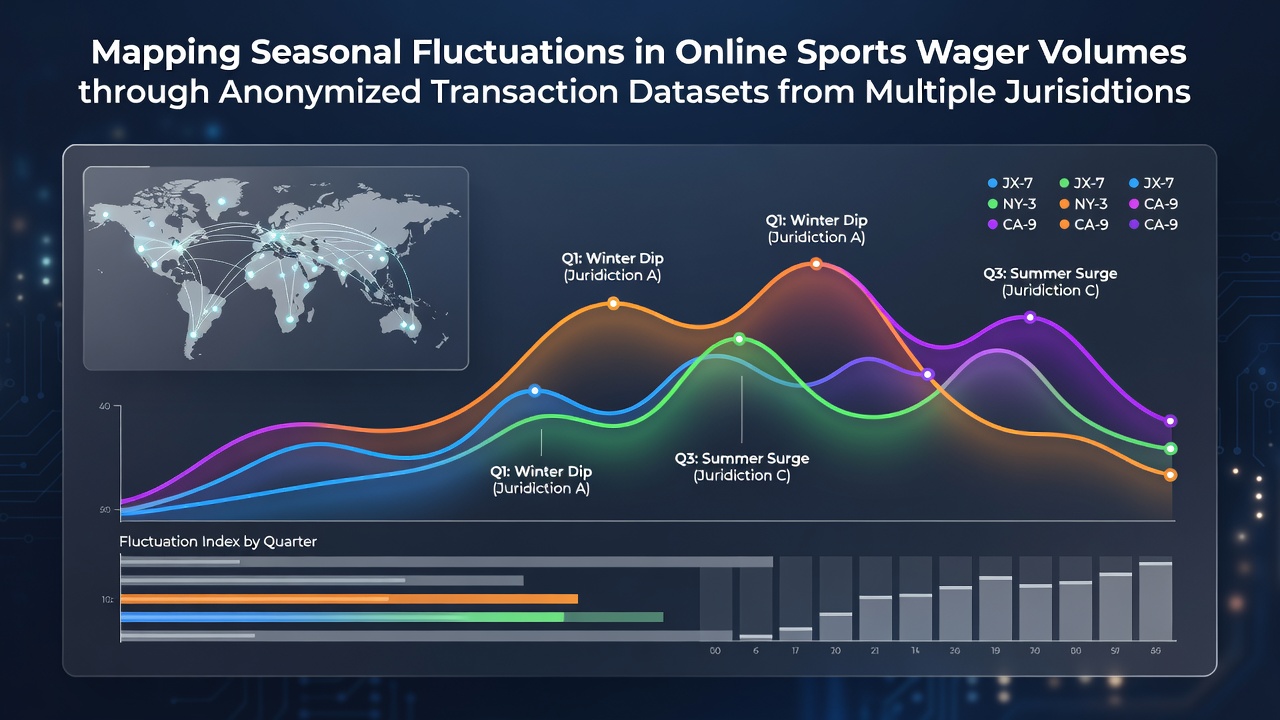
Analysts have turned to anonymized transaction datasets drawn from multiple jurisdictions to trace how online sports wager volumes shift with the seasons, and patterns emerge when researchers aggregate records spanning several years. These datasets strip away personal identifiers while preserving details like bet size, sport type, timing, and geographic origin, which allows teams to compare activity across borders without compromising privacy standards. Jurisdictions in North America, Europe, and Australia supply the bulk of available records, each governed by distinct regulatory frameworks that shape what information gets collected and released for study.
Data Aggregation Methods Across Borders
Teams combine streams from state-level regulators in the United States with provincial authorities in Canada and national bodies in Australia, then apply consistent normalization techniques so that differences in currency and reporting periods do not distort comparisons. One study compiled more than 180 million transactions from 2022 through early 2026, grouping them by calendar month and major sporting calendar events. The process reveals recurring peaks during autumn months when American football schedules dominate, followed by noticeable dips in late winter once those seasons conclude, while European soccer leagues produce steadier but smaller waves throughout the year.
Seasonal Patterns Identified in the Records
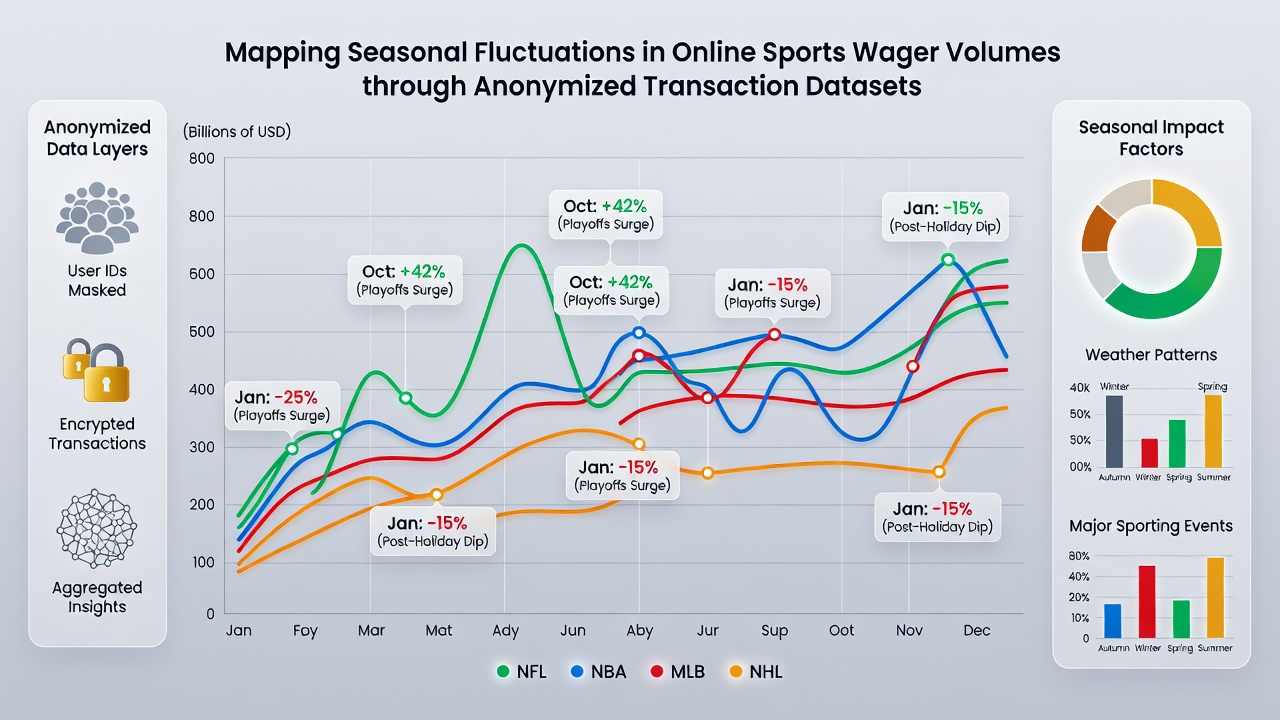
Figures compiled from several sources show wager volumes rising sharply in September and October across North American platforms, driven by the start of professional and college football seasons, and the same datasets register secondary spikes around March when basketball tournaments reach their conclusion. Australian records, by contrast, display elevated activity during summer cricket and tennis events, creating a counter-cyclical pattern that smooths aggregate global volumes when all jurisdictions are viewed together. Researchers note that transaction counts often climb 25 to 40 percent above annual averages during these concentrated periods, yet average bet sizes remain relatively stable, suggesting the increase stems from greater participation rather than larger individual wagers.
Jurisdictional Differences and Regulatory Influences
State regulators in New Jersey and Pennsylvania publish monthly summaries that feed directly into these analyses, while the Nevada Gaming Control Board releases aggregated sports betting handle data that researchers cross-reference with anonymized transaction logs. Canadian provinces contribute through their respective gaming corporations, which track online volumes separately from land-based facilities, and Australian state commissions supply comparable figures that highlight the impact of different tax structures and advertising rules. These variations affect how sharply volumes respond to seasonal triggers, because tighter advertising windows in some regions blunt the usual surge that accompanies major tournaments.
Additional context comes from a 2025 report issued by the University of Nevada, Las Vegas International Gaming Institute, which examined transaction timestamps and found that mobile app activity accelerates during evening hours in every jurisdiction studied, regardless of the sport in season. The same report documented a modest but consistent uptick in live in-play betting during summer months when fewer marquee events occur, indicating bettors seek alternative outlets when traditional schedules thin out.
Impact of Calendar Events and Weather Variables
Cross-referencing transaction timestamps with major event calendars shows that volumes contract during periods without overlapping league play, such as the brief gaps between the end of one season and the start of another. Weather data layered onto the same datasets reveals secondary effects in certain markets, where prolonged cold snaps correlate with higher indoor activity on mobile platforms, although the relationship weakens once researchers control for the underlying sports calendar. Observers note that these secondary signals remain smaller than the primary seasonal swings tied to league schedules.
Trends Observed Through Mid-2026
Records processed in June 2026 continue to reflect the established seasonal rhythm, with spring months posting lower totals than autumn peaks, yet overall baseline volumes sit higher than equivalent periods in 2023. Growth in new account registrations during the prior off-season appears to have lifted the floor rather than altering the shape of the seasonal curve, according to preliminary tallies released by several regulatory bodies. Analysts continue to monitor whether expanded mobile payment options or changes in bonus structures will introduce new deviations from the patterns documented so far.
Conclusion
The use of anonymized transaction datasets has enabled consistent mapping of seasonal fluctuations in online sports wager volumes across diverse regulatory environments, and the resulting profiles help operators and regulators anticipate resource needs tied to predictable calendar cycles. Continued expansion of available data sources promises finer geographic resolution and faster updates, supporting more precise modeling of how external events interact with established seasonal rhythms.