Tracing Algorithmic Nudges in Live Sports Betting Interfaces and Their Documented Effects on Wager Sizing Patterns Among Frequent Users
Written by Cameron Baumann · Jul 15, 2026
Tracing Algorithmic Nudges in Live Sports Betting Interfaces and Their Documented Effects on Wager Sizing Patterns Among Frequent Users
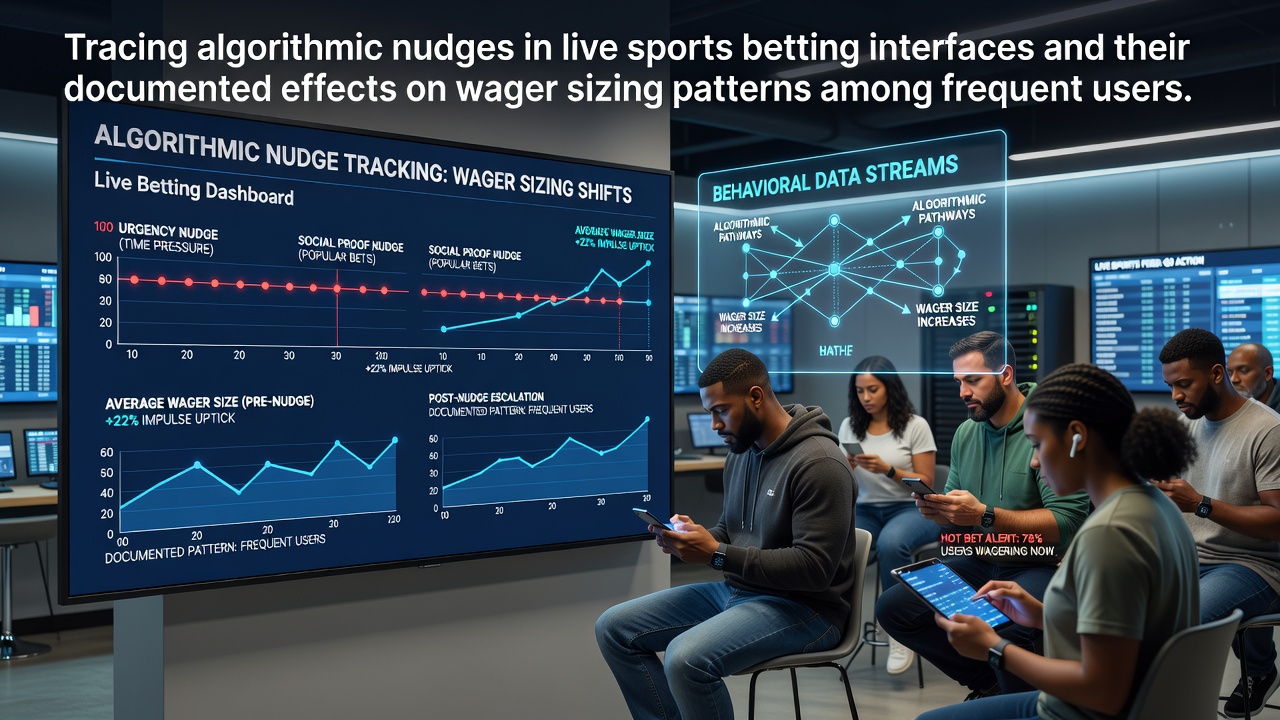
Live sports betting platforms rely on algorithmic systems that present users with pre-selected wager amounts, highlighted quick-bet options, and dynamic prompts that adjust based on real-time odds and individual betting history, and these elements appear in applications across major markets throughout 2026. Observers note that such features operate continuously during events, where the interface updates suggested stakes as game situations evolve, which connects directly to recorded changes in how frequent users adjust their bet sizes within single sessions.
Interface Mechanics and Nudge Implementation
Developers integrate these nudges through code that analyzes prior wagers, current bankroll levels, and live event data to surface specific dollar amounts or multipliers, while buttons for larger increments often receive visual emphasis through color contrast and placement at the top of selection menus. Frequent users encounter these prompts repeatedly across multiple matches, and data logs from platform providers show that selections cluster around the highlighted figures more often than random distribution would predict. Researchers tracking session archives have mapped sequences where an initial small stake leads to subsequent prompts for higher amounts once the first wager settles, creating chained patterns visible in timestamped activity records.
Documented Shifts in Wager Sizing
Analysis of user datasets from several North American operators reveals consistent upward drift in average stake values among accounts classified as frequent, defined as those placing at least fifteen wagers per week, and this drift correlates with exposure to algorithmic suggestions rather than external factors alone. Figures released in mid-2026 by state regulatory bodies indicate that sessions containing multiple nudge interactions produce median wager increases of 18 to 27 percent compared with sessions that bypass the suggested options, and the pattern holds across football, basketball, and soccer markets. One study compiled from anonymized transaction records found that users who accepted three or more pre-filled amounts within an hour-long window showed elevated sizing in later events, even when those later events carried different risk profiles.
Platforms continue to refine these systems in July 2026, incorporating additional variables such as time remaining in matches and user response latency to previous prompts, which allows finer calibration of the displayed options. Those who have examined the resulting logs report that nudge acceptance rates rise during high-volatility moments, such as overtime periods or penalty situations, where the interface presents scaled-up amounts alongside live odds updates.

Patterns Across User Cohorts and Timeframes
Longitudinal tracking conducted by independent research groups demonstrates that the effect compounds over weeks, with frequent users exhibiting progressively larger standard deviations in stake amounts after sustained exposure to the same interface elements. Accounts active for more than six months display stronger alignment between suggested values and actual selections than newer accounts, suggesting adaptation to the prompt structure. Data aggregated from Canadian provincial operators and Australian state regulators shows parallel trends, where the percentage of wagers falling within ten percent of the most prominent nudge rises steadily across repeated sessions.
Regional differences emerge in implementation details yet produce comparable sizing outcomes, for instance platforms licensed in New Jersey display nudges tied to parlay builders more prominently than those in Nevada, while both environments record similar lifts in average stake when users engage the live-betting module multiple times per event. New Jersey Division of Gaming Enforcement reports compiled through June 2026 list these metrics alongside overall handle figures, allowing direct comparison of nudge-exposed versus non-exposed cohorts within the same operator datasets.
Measurement Approaches and Available Evidence
Researchers employ A/B testing frameworks embedded in live applications to isolate nudge impact, comparing cohorts that receive standard prompts against those served neutral or randomized alternatives, and results consistently point to elevated sizing in the standard condition. Archived session files further permit reconstruction of decision trees, revealing that users rarely override the top-positioned suggestion once the interface has presented it for more than two seconds. Academic teams at institutions such as the University of Nevada, Las Vegas have cross-referenced these trees with demographic tags to confirm the pattern persists across age groups and geographic segments represented in the data.
Additional context comes from industry reports that quantify prompt frequency, noting that live interfaces generate between four and nine distinct nudge events per average soccer match and between six and eleven during basketball games, each calibrated to the remaining game clock and score differential. These counts correlate with the observed expansion in wager ranges, particularly among users whose historical data indicates prior acceptance of similar prompts.
Conclusion
Records compiled through the first half of 2026 establish measurable connections between algorithmic presentation choices in live sports betting interfaces and subsequent wager sizing adjustments among frequent users, with the patterns appearing across multiple regulatory jurisdictions and operator platforms. Continued monitoring by research organizations supplies updated distributions that track how these interface elements evolve alongside event calendars, providing ongoing visibility into the documented relationships without requiring subjective interpretation of intent or outcome.