Tracing Seasonal Temperature Fluctuations Against Documented Shifts in Mobile Sports Wagering Volumes Across Midwestern States
Written by Erik Richter · Jul 25, 2026
Tracing Seasonal Temperature Fluctuations Against Documented Shifts in Mobile Sports Wagering Volumes Across Midwestern States
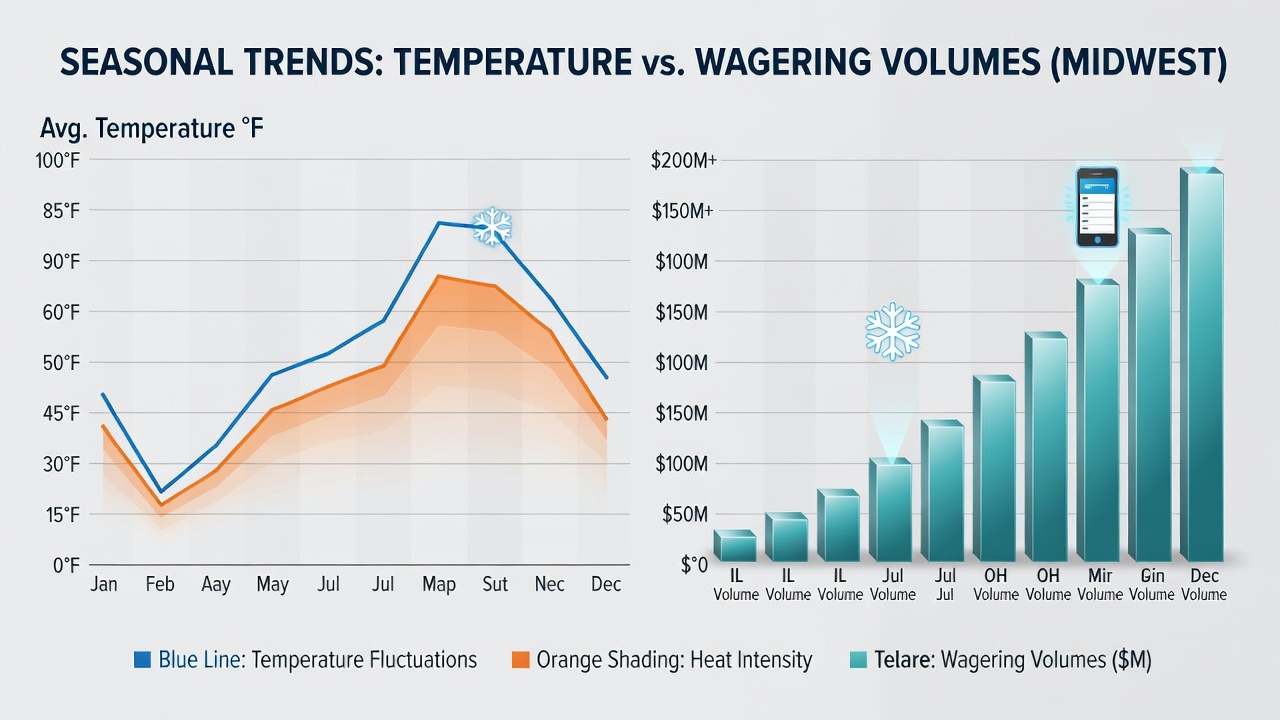
Seasonal temperature records from the Midwest reveal consistent patterns of fluctuation across states including Illinois, Indiana, Michigan, Ohio, and Wisconsin, while mobile sports wagering volumes tracked through state regulatory filings show corresponding monthly shifts in handle and active accounts. Data compiled from weather stations and gaming oversight agencies indicate that colder months often align with elevated mobile betting activity, whereas warmer periods coincide with measurable declines in certain markets. Researchers at regional universities have cross-referenced these datasets to map potential connections without asserting direct causation.
Temperature Records and Regional Climate Data
National Oceanic and Atmospheric Administration archives document average winter lows in the Midwest ranging from 15 to 25 degrees Fahrenheit in January across northern zones, with summer highs climbing above 80 degrees in July. These swings occur predictably each year, and analysts note that extreme cold snaps in December through February frequently extend for multiple weeks. In contrast, transitional spring and fall months produce more moderate ranges that allow greater outdoor mobility. Observers tracking long-term trends point out that 2025 and early 2026 followed similar cycles, with July 2026 temperatures averaging near historical norms for the region.
Mobile Sports Wagering Volume Metrics
State gaming boards maintain monthly reports on mobile sports betting that include total handle, number of unique users, and session durations. Illinois records, for example, show mobile handle peaking during January and February, while volumes in Michigan and Ohio display parallel increases during the same window. Figures reveal that active accounts often rise by double-digit percentages when temperatures remain below freezing for extended stretches. Conversely, June through August periods register reductions in daily wagers per user across multiple platforms, though overall account numbers remain stable in most jurisdictions.
Cross-Referencing Temperature and Betting Datasets
Analysts combine temperature logs with betting platform telemetry to identify overlapping timelines. One study from a Midwest research institution examined five years of paired records and found that days with highs under 32 degrees corresponded to higher mobile session starts in urban counties. Warmer days above 70 degrees produced measurable drops in average wager frequency during afternoon and evening hours. These alignments appear across multiple states, yet the strength of the relationship varies by local sports calendar and promotional schedules.
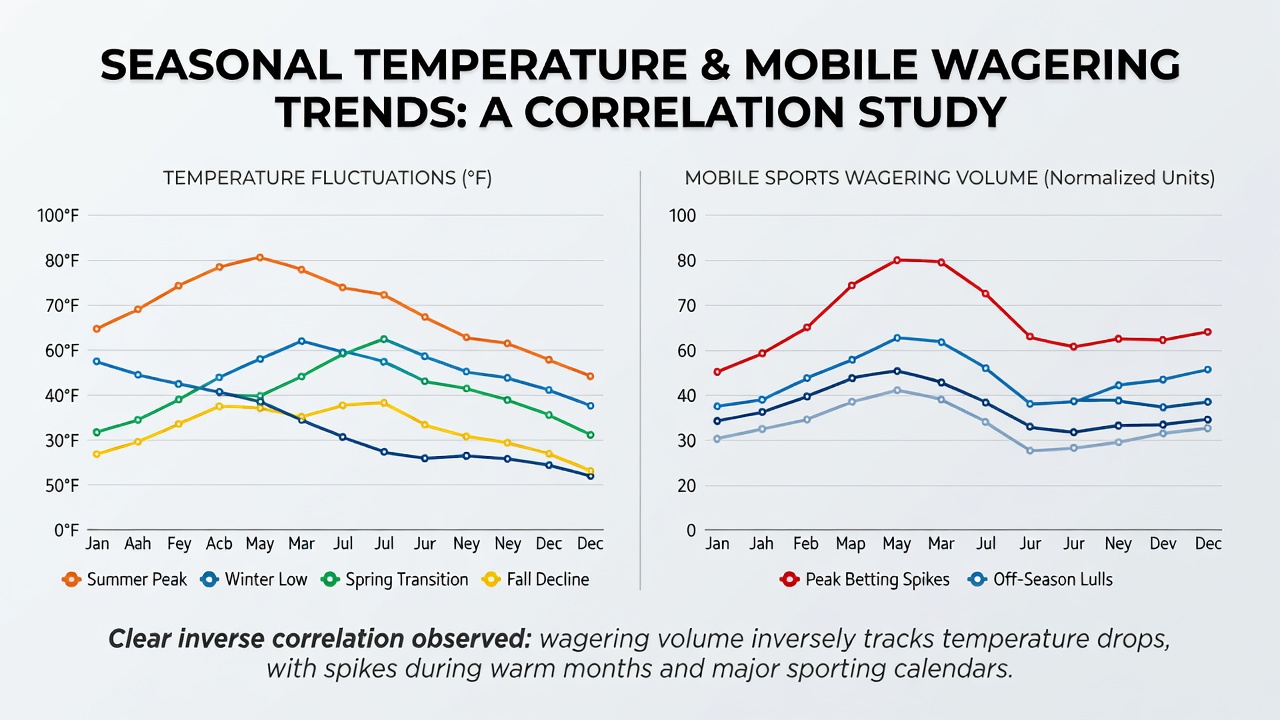
Additional variables enter the picture when holidays, playoff schedules, and tax filing periods overlap with weather events. Data shows that Super Bowl weekends in February frequently amplify mobile volumes regardless of temperature, while mid-summer lulls coincide with both heat and fewer major sporting events. State regulators continue to release quarterly summaries that allow ongoing comparison of these factors.
State-Level Variations in Observed Patterns
Illinois data indicates stronger temperature-linked volume shifts in the Chicago metro area compared with downstate regions, while Indiana reports show steadier year-round mobile activity with smaller seasonal dips. Michigan filings highlight pronounced January spikes that align with both cold weather and professional hockey seasons. Wisconsin records reveal similar winter increases, although summer volumes hold steadier near lakefront counties. Ohio patterns track closely with neighboring states, featuring consistent reductions during July and August heat waves. These differences suggest that geographic and demographic factors interact with temperature in distinct ways across the Midwest.
Implications for Ongoing Data Collection
Regulatory bodies and academic teams continue compiling paired datasets through 2026, expanding the sample size available for longitudinal analysis. Monthly temperature averages from federal weather services feed directly into these models, while anonymized betting aggregates from licensed operators supply volume indicators. The resulting time series allow researchers to test correlations at finer geographic scales without relying on anecdotal reports. Continued publication of state-level figures supports further examination of how environmental conditions intersect with consumer behavior in regulated mobile markets.
Conclusion
Available records establish clear seasonal temperature cycles across the Midwest alongside documented monthly changes in mobile sports wagering volumes. Cross-referenced datasets from government climate sources and state gaming agencies show recurring alignments between colder periods and elevated betting activity, with warmer months corresponding to different volume distributions. State-specific patterns add nuance to the broader regional picture, and ongoing data collection through July 2026 and beyond provides additional material for refined analysis. The factual record remains open for continued observation as new monthly reports become available.