Tracing Variance Distributions in Multi-Player Video Poker Networks Through Archived Session Data
Written by Elena Günther · May 27, 2026

Tracing Variance Distributions in Multi-Player Video Poker Networks Through Archived Session Data
Analysts examine variance distributions in multi-player video poker networks by reviewing archived session data that spans thousands of hands across interconnected terminals, and this approach reveals how payout fluctuations cluster when players compete simultaneously on shared progressive systems. Researchers compile logs from centralized servers that record bet amounts, hand outcomes, and jackpot contributions, then apply statistical models to map deviations from expected return rates.
Core Concepts in Variance Analysis
Video poker variants such as Jacks or Better and Deuces Wild generate distinct variance profiles because each game uses fixed paytables that determine the frequency of high-payout hands, while multi-player setups introduce additional layers as progressive meters accumulate across linked machines in different locations. Data scientists calculate variance by measuring the squared differences between actual session results and theoretical means, then segment those figures by player count and network size to identify patterns that single-player data alone cannot expose.
Archived Session Data as Primary Resource
Operators store session records that include timestamps, machine identifiers, player loyalty tags when available, and complete hand histories, allowing analysts to reconstruct sequences of play without relying on real-time observation. Studies conducted through university gaming research programs demonstrate that datasets covering at least 500,000 hands provide sufficient granularity to separate short-term noise from longer-term distribution trends, and these collections often extend back several years to capture seasonal variations in player volume.
Network-Level Distribution Tracing Methods
Teams process archived logs through algorithms that cluster sessions by shared network nodes, then apply kernel density estimation to visualize how variance spreads when multiple terminals draw from the same progressive pool. This technique highlights periods when simultaneous high-variance hands occur more frequently than independent probability models predict, and the resulting heat maps guide adjustments to meter contribution rates. One research group at a North American institution cross-referenced session archives from three regional casino groups and found that variance spikes aligned with peak hours when player density exceeded 12 active terminals per network segment.
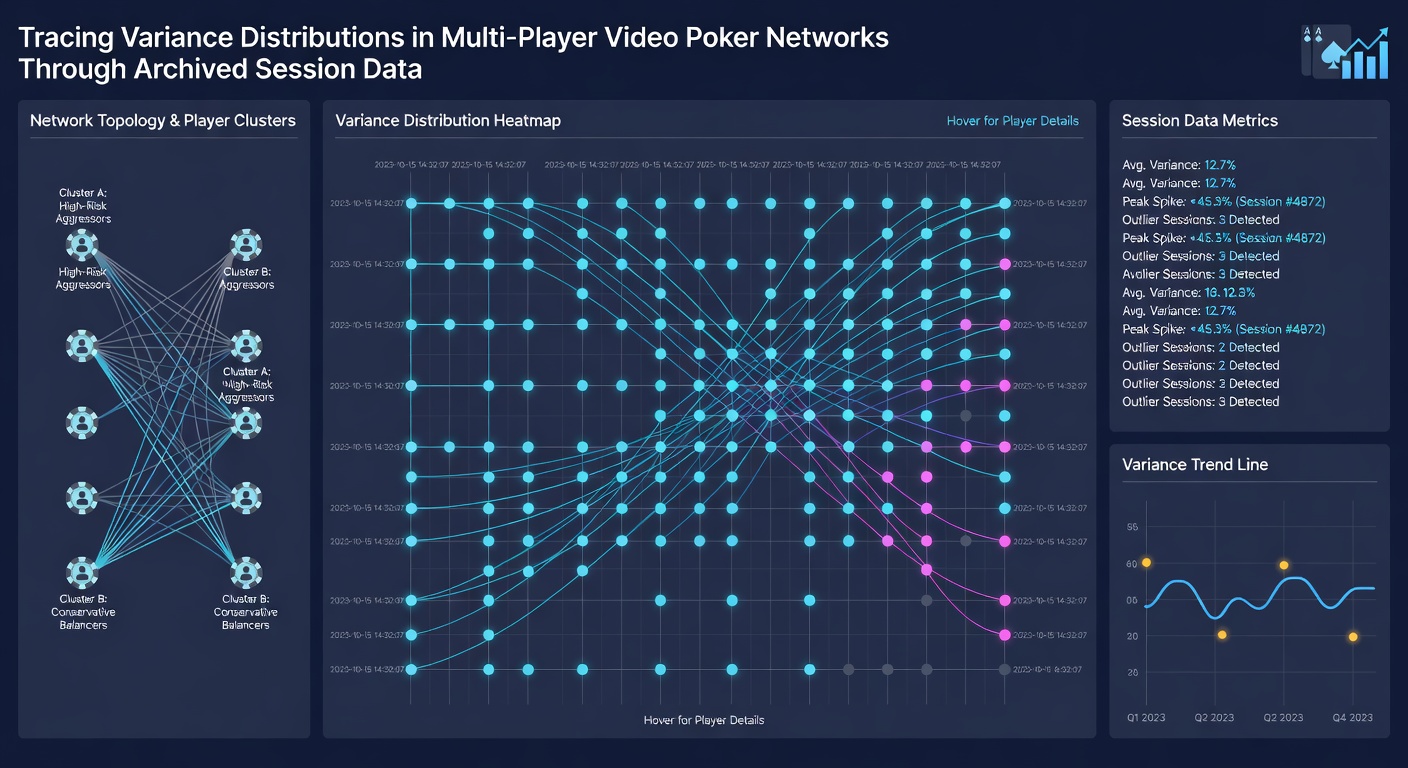
According to reports from the Nevada Gaming Control Board, operators must retain detailed electronic records for regulatory audits, and these mandated archives supply the raw material for variance studies that extend beyond individual property boundaries. Analysts normalize the data for machine denomination and game version before running Monte Carlo simulations that test whether observed distributions deviate from theoretical baselines at statistically significant levels.
Practical Applications in 2026 Operations
By May 2026 several multi-state operators had integrated real-time variance dashboards fed by historical session archives, enabling floor managers to adjust machine groupings when distribution curves showed excessive clustering around high-variance nodes. These systems flag networks where progressive contributions create unintended volatility, and adjustments occur through recalibration of seed amounts or contribution percentages rather than hardware changes. Canadian provincial regulators in Ontario have published aggregated network performance summaries that support similar internal reviews, providing comparative benchmarks for properties operating across provincial lines.
Researchers note that combining loyalty program identifiers with session timestamps allows segmentation of variance by player cohort, revealing whether high-volume participants experience different distribution patterns than casual visitors. One documented analysis of a 14-terminal video poker bank in a Midwest market showed that sessions initiated during tournament overlaps produced variance coefficients 18 percent higher than non-overlap periods, prompting operators to stagger event scheduling.
Conclusion
Tracing variance distributions through archived multi-player video poker session data supplies operators and regulators with measurable insights into network behavior that static probability tables cannot capture. Continued refinement of clustering algorithms and expanded access to standardized archives from additional jurisdictions should further clarify how interconnected terminals influence payout stability across entire casino floors.